Small investors – including desperate retirees who saw their income from their life savings dwindle to near zero since the Fed decided to sacrifice them on the altar of the banks – have jumped back into the stock market. Suddenly, they don’t want to miss out on the rally they’ve been missing out on for the past five years.
E*Trade reported that daily client trades in the fourth quarter, after three years of malaise, had jumped 25% from a year earlier; and in January 27%. At TD Ameritrade, trades soared 24% in the third quarter and 28% in January. At Charles Schwab, trades rose 8% in the third quarter but then jumped 17% in January to a five-year high.
Small investors are having fun again. To speed up their gains, they’re leveraging up their portfolios. And margin debt is spiking beautifully.
Leverage speaks of investor confidence. Of exuberance even. Borrowing money to buy stocks creates demand and drives up prices. Higher prices encourage players to borrow even more. And the stock market hobbles from one high to the next, with no end in sight. That’s the beauty of leverage. It’s free money. Nothing can ever go wrong.
“People are feeling excited and back in the game,” explained Kim Githler, CEO of MoneyShow, which managed the International Traders Expo in New York, one of the innumerable investor conferences that have been popping up around the country. “The energy is so different,” she said.
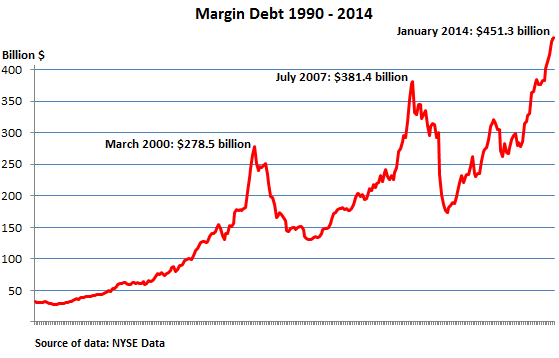
So their buying stocks, and trading stocks to make a living is in vogue again, just like during the last two bubbles, and they’re piling on margin debt. In January, despite the rough spots that stocks went through, margin debt rose by $6.4 billion. Over the past six months, it spiked $68.4 billion to $451.3 billion, 18% above the prior bubble peak:
Alas, margin debt, after it starts spiking, has a disturbing habit of peaking right around the time the bubble turns into a crash. In September 1987, margin debt peaked at $44 billion, or 0.88% of GDP. On October 19, stocks headed south. Brokers got on the phone and told their frazzled clients with suddenly too much margin debt to put more money into their accounts (Right now? You gotta be kidding!) or sell their holdings. And as margin debt was unwound by dumping whatever could be dumped at whatever price, the selloff turned into a plunge.
By March 2000, the Greenspan easy-money Fed was in full bloom, and margin debt hit a record of $278.5 billion, or 2.66% of GDP. It was the very month the hot air started hissing out of the dotcom bubble. Stocks swooned, which led to bouts of forced selling, and after 28 months, the S&P was down 45%, the Nasdaq nearly 80%!
It didn’t take long for people to forget. Soon, margin debt spiked again to peak in July 2007 at $381.4 billion, or 2.60% of GDP. The market peaked in October then headed down. Forced selling kicked in when there were suddenly no buyers, which drove stocks down further and triggered more forced selling, a self-reinforcing loop. Hedge funds too, many of them leveraged to the teeth and hearing the giant sucking sound of redemptions, were forced to sell. The S&P 500 swooned 57%.
So in January 2014, margin debt hit $451.3 billion – 2.69% of GDP, the highest ratio ever.
Are we there yet? Margin debt fails miserably as predictor of a crash because no one knows if January was an absolute peak, an interim peak, or just another stage on the way to a much more dazzling peak.
But margin debt, which is based on what brokers report to the NYSE, accounts for only a fraction of the total leverage in the stock market. Stocks, like any asset, can be leveraged in a myriad ways. Executives often borrow from their company and put up their company stock as collateral. It’s a way of cashing out without selling. The largest players, such as hedge funds, can borrow in the shadow banking system. No one really knows the extent of leverage in the stock market. Margin debt is just one of the indicators. And that indicator is redlining.
If this leverage is unwound in a tsunami of selling, the small investors and retirees who were “feeling excited and back in the game,” as Ms. Githler put it so eloquently, those who recently jumped in after having missed years of mega-gains, those who were buying what the smart money was selling, they’re participating in a giant Fed-engineered wealth transfer. And they’re going to get their clocks cleaned. Again.
Same is happening in real estate. National averages paper over gritty details on the ground and are a crummy indicator as to what is happening in specific metro areas. But even with this caveat, a national average suddenly sounded an alarm for the housing market. Read….The Smart Money Quietly Abandons The Housing Market
Enjoy reading WOLF STREET and want to support it? You can donate. I appreciate it immensely. Click on the mug to find out how:

![]()