The civilian labor force in the US has been causing bouts of hand-wringing and head-scratching. It represents the official number of people working or looking for work. It’s what the official unemployment rate (U-3) is based on. If labor force participation drops – if for whatever reason, millions of people are no longer counted as part of the labor force, as is the case in the US – it’s a troublesome indicator for the economy and the real employment picture.
It also makes the unemployment rate, now 7.3%, look a lot less awful: if you’re not counted in the labor force, and you don’t have a job, you’re not counted as unemployed. There are millions of people in that category. And their numbers are growing, not diminishing.
“The irony of the U-3 unemployment statistic is the fact that while unemployment has gone down 30% since its 2009 peak, we have the lowest labor force participation rate in over 3 decades,” observed Ralph Dillon, Vice President at Global Financial Data, in an email. “The markets and politicians celebrate the official unemployment rate, but you have to be concerned with the trend that is most indicative of the health of the employment situation in this country: the downward trend of those who want to work and can’t.”
Before the financial crisis, the unemployment rate and the labor force participation rate weren’t correlated. Unemployment would jump up and down, based on the economy, but labor force participation moved to its own drummer:
“During the 1970s and 1980s, the labor force grew vigorously as women’s labor force participation rates surged and the baby-boom generation entered the labor market,” explained the Bureau of Labor Statistics. The labor force participation rate hit an all-time peak in early 2000 of 67.3%. “However, the dynamic demographic, economic, and social forces that once spurred the level, growth, and composition of the labor force have changed….” And labor force participation has since dropped to 63%.
The chart (Global Financial Data) juxtaposes the unemployment rate and the labor force participation rate since 1980. After the financial crisis, suddenly, for the first time in history, they both started moving in lockstep. Downward.
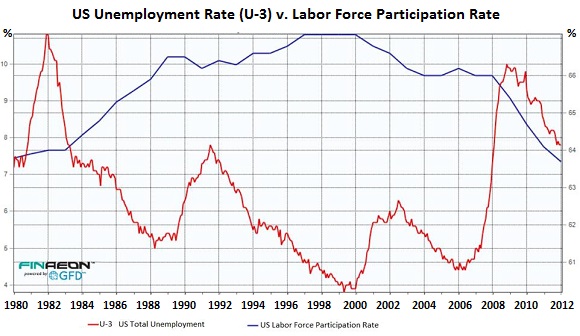
“This chart is a true representation of the crisis of employment in this country,” Dillon wrote. The diminishing labor force participation rate – the officially available labor pool, however unrealistic it might be – has been driving down the unemployment rate for the first time in history.
But beneath the overall numbers, it’s even worse. This chart by the BLS depicts labor force participation rates in 1992, 2002, and 2012, with an estimate for 2022:
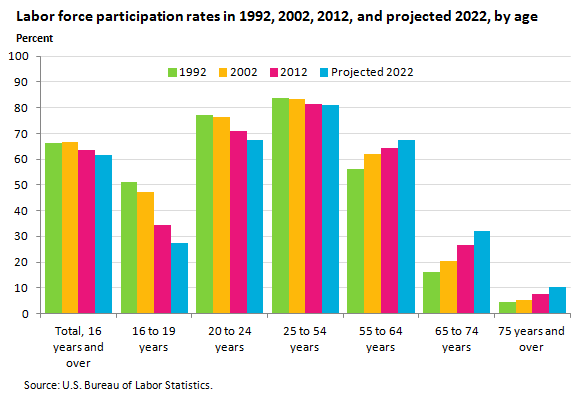
People 55 to 64 years old, the first forget-about-retirement generation, are staying in the labor force to an ever greater degree. In 1992, only 56.2% were still in the labor force, in 2012, 64.5% were. Similar for older folks. The participation rate for people 65 to 74 years old jumped from 16.3% to 26.8%. Reality is this: fewer people can afford to retire.
But who is not making it into the labor force? Young folks. The participation rate for those 16 to 19 has plunged from 51.3% in 1992 to 34.3% in 2012. OK, the BLS explains that by an increase in school attendance, and that would be a good thing. But the 25 to 54 year olds? Even among them, participation rates dropped from 83.3% in 2002 to 81.4% a decade later.
Among the 18 to 34 year old “Millennials,” those lucky ones who’re official counted in the labor force, unemployment has been a nightmare, with double digit unemployment rates, still, nearly 6 years after the financial crisis, reported the youth advocacy group Young Invincibles. It’s even worse for the 16 to 24 year olds, whose official unemployment rate is still 15%!
In prior downturns, the employment rate for young adults nearly reached pre-recession levels within 5 years. In the Great Recession, young adult employment had not even recovered halfway by the same point. A quarter of all job losses for young adults came after the Great Recession was officially over. The lack of jobs had driven many discouraged young people from the labor force altogether. A recent report by Opportunity Nation estimates that 5.8 million young adults are neither working nor in school.
Sure, companies have been creating jobs since the Great Recession, but only at the growth rate of the working-age population, as evidenced by the BLS’s dreary employment-population ratio. It peaked in April 2000 at 64.7%, crashed during the Great Recession, and has been skittering along the bottom ever since. At 58.6%, it’s lower than it was during most of 2009! And the 30% improvement in the official unemployment rate – where the heck did that come from? The chart has the answer: people 54 and younger being statistically purged from the labor force.
Fed Chairman Bernanke wanted to reflect on the “accomplishments of the past eight years” and demolish “sceptics” that still doubted the Fed was the best thing since sliced bread. His policies “have helped promote the recovery,” he said. The recovery of what? Read…. Bernanke’s Delirious Praise For His Handiwork, The Concentration Of Power At the Top Banks
Enjoy reading WOLF STREET and want to support it? You can donate. I appreciate it immensely. Click on the mug to find out how:

![]()